x

Quantitative - Mathematics - Data Interpretation:

Bar Charts

MCQ - 25-3919

Question:

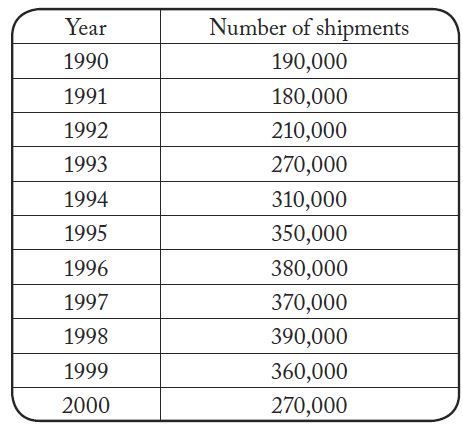
According to the chart shown, which of the following is closest to the median annual number of shipments of manufactured homes in the United States for the years from 1990 to 2000, inclusive?

01 di bargraph -69444120

  1. 250,000
  2. 280,000
  3. 310,000
  4. 280,000
  5. 340,000

Correct Answer: C

Explanation:

From the chart, the approximate numbers of shipments are as follows:
02 di bargraph -15433433

Since there are 11 entries in the table and 11 is an odd number, the median of the numbers of shipments is the 6th entry when the numbers of shipments are arranged in order from least to greatest. In order, from least to greatest, the first 6 entries are:

03 di bargraph -22767146

The 6th entry is 310,000.

Th e correct answer is C.

Record Performance

82 MCQ for effective preparation of the test of Bar Charts of Data Interpretation section.

Read the MCQ statement: According to the chart shown, which of the following is closest to the median annual number of shipments of manufactured homes in the United States fo .... o 2000, inclusive? , keenly and apply the method you have learn through the video lessons for Bar Charts to give the answer. Record your answer and check its correct answer and video explanation for MCQ No. 25-3919.

How to Answer

Solve the question for MCQ No. and decide which option (A through D/E) is the best choice to answer the MCQ, then click/tap the blue button to view the correct answer and it explanation.

Share This Page