The slope, which we will call m, is then defined formally as delta y / delta x. Now delta is a mathematician's way of saying change. So delta y is the change in elevation, and delta x is the change in distance, or how far forward we're going to go. So we can write our slope out as delta y / delta x, or (y sub 2 - y sub 1) / (x sub 2 - x sub 1). We can use this formula to calculate the slope between (2,1) and (4,7). I'm going to call (2,1) my start point and (4,7) my endpoint. In this case, 2=x sub 1, 1=y sub 1, 4=x sub 2 and 7=y sub 2. So we find our slope m= (7 - 1) / (4 - 2) = 6 / 2 = 3, exactly as expected!
Let's find the slope of the line connecting (1,8) and (5,6). So, (1,8) is going to be my start point, and (5,6) is going to be my endpoint. Again plugging in our points, our slope m = delta y / delta x = (y sub 2 - y sub 1) / (x sub 2 - x sub 1) = (6 - 8) / (5 - 1) = -2 / 4 = -0.5, or -1/2. The slope is negative, so the connecting line goes down and to the the right. This is like when I fall down the hill as opposed to the mountain goat traveling gracefully up the hill.

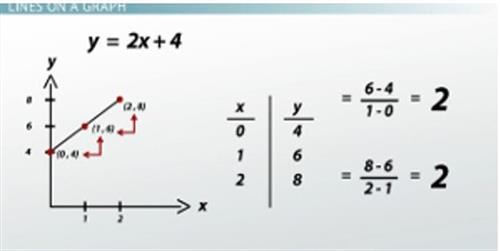
Slope of the line given by y = 2x + 4
What is the slope of the line given by the equation y= 2x + 4? First, let's graph this by plotting a few points and connecting them with a smooth curve. I have the points (0,4), (1,6), (2,8). Now let's calculate the slope between the first two points. The slope m= (6 - 4) / (1 - 0) = 2. What if we calculate the slope between the last two points? The slope m= (8 - 6) / (2 - 1) = 2. The slopes are the same! Well, that makes sense because the graph here is a straight line.
Tangents
What about the slope of the curve given by the equation y=x^2? The graph of this curve looks like this. Slope has no meaning here. Would we calculate the slope between the bottom of the curve and a point where x is greater than 1? Less than 1? Here the slope has no meaning in particular, so what do we look at instead? For graphs that are not straight lines, there is no single slope. Instead we look at something called the tangent. The tangent is the slope of a curve at a single point on that curve. At any point along the curve, there is a line that touches the curve, but does not cross the curve. Up here, the tangent has a very negative, steep slope. Here, it's more shallow. Here, the slope of the tangent is zero.
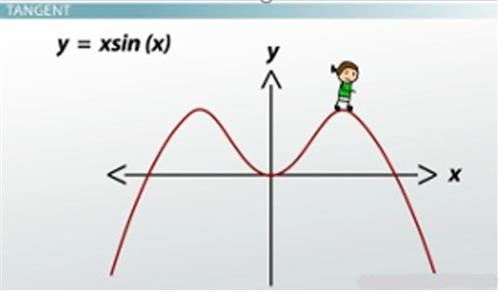
Let's look at the slope of the tangents for another equation. Here we have y= x × sin(x).

Graph of the tangents for y = x ×sin(x)
Let's imagine I'm walking up the slope of this equation. At first, the slope is very steep, so I'm having a really difficult time walking up it. As I get closer to the top of the hill, it gets a little easier. When I get to the top of the hill, I'm just standing there, and the slope of the tangent is zero. I move forward and start to go downhill as it levels off, and I can just stand there. I can walk up the second hill and stand again before falling down when the slope gets very steep and negative.
Lesson Summary
The slope of a line is a number that describes how steep it is. A larger number corresponds to a steeper slope, like the hills in San Francisco, and a smaller number corresponds to a more shallow slope, like the so-called hills in Chicago. Positive slopes are pointed upward, and negative slopes are pointed downward. We calculate the slope by finding the change in y over the change in x. This is like saying the change in elevation, or height, over the distance we move forward. Finally, tangents are slopes at single points along curves. We use these when the curve doesn't have a single slope, and the slope is changing at every point.